Saturday, February 21, 2015

Choosing a Health Plan

Three Questions the American Medical Association Wants Patients to Consider before Choosing a Health Plan

As Open Enrollment for 2015 Exchange Plans gets underway, patients are being bombarded with messages from health insurance companies vying for their attention. The American Medical Association (AMA) urges patients to thoroughly review all aspects of the plans they are choosing in order to prevent interruptions in care and higher out-of-pocket costs.

Whether it's a new plan or a renewal of an existing plan, there are many factors patients should take into account including deductibles, co-pays and drug costs. Patients should also consider which physicians and facilities are covered under their health insurance plan and the cost for receiving treatment out-of-network so that they make informed health care decisions. Additionally, patients should make sure to ask their physicians whether they are participating in plans they are considering.

"We want to make sure Americans choose a plan that is right for them and their families in terms of cost and coverage," said AMA President Robert Wah, MD. "It is very important that patients look beyond the big print, color-coded plan designations and price of insurance plans and check the small print details before making their selection. Patients deserve to know what coverage they're buying when they choose a health insurance plan, including the physicians they will have access to. This will ensure they are selecting a health plan that has the value they need."

AMA asks patients to consider the following: 

1)   Are your family's doctors in the plan?  If not, what will you have to pay out-of-pocket for office visits or other services your doctor prescribes?  Is the plan's directory of participating physicians up-to-date and accurate?  Are there physicians on the list who are still accepting new patients?
2)   What does the plan cover?  What percentage of your health care costs will you have to cover? If so, how much and can you afford it? How much will you have to pay out of pocket for the medicines your family needs? Will you be able to use hospitals, labs and other facilities that are convenient to where you live or work? Does the plan provide access to a sufficient number of specialists that you need?
3)   Does your primary care physician have to receive permission from the insurance company to refer you to a specialist?  Does that rule include specialists you see regularly for a chronic condition? Does the insurer use penalties or incentives to induce physicians in the plan to limit referrals in any way?

Yesterday, the AMA joined with the Children's Hospital Association and more than 115 organizations representing hospitals, physicians, and other health care providers serving children and adults in sending a letter to the National Association of Insurance Commissioners (NAIC) calling for network adequacy for patients, greater regulatory oversight in the hands of commissioners and increased transparency for health insurers.

The AMA is dedicated to ensuring patients have access to the care they need and is addressing insurance network adequacy through a new policy passed at its Interim meeting on November 10. The policy supports strengthening the monitoring and enforcement of network adequacy at the federal and state levels and also offers additional financial protection for patients who need to seek care out-of-network.

Ref: Randi.kahn@ama-assn.org

Emergency Department Visits for Motor Vehicle Traffic Injuries: United States, 2010–2011

Data from the National Hospital Ambulatory Medical Care Survey, 2010–2011
  • In 2010–2011, the emergency department (ED) visit rate for motor vehicle traffic injuries was highest among persons aged 16–24 years. The rates declined with age after 16–24, with rates for those aged 0–15 similar to those 65 and over.
  • The overall ED visit rate for motor vehicle traffic injuries was higher among non-Hispanic black persons compared with non-Hispanic white and Hispanic persons.
  • Imaging services were ordered or provided at 70.2% of ED visits for motor vehicle traffic injuries, which was higher than for other injury-related ED visits (55.9%).
  • About one-half of ED visits for motor vehicle traffic injuries had a primary diagnosis of sprains and strains of the neck and back, contusion with intact skin surface, or spinal disorders.
In spite of improvements in motor vehicle safety in recent years, motor vehicle crashes remain a major source of morbidity and mortality in the United States (1–3). Motor vehicle-related deaths and injuries also result in substantial economic and societal costs related to medical care and lost productivity (4). This report describes the rates and characteristics of emergency department (ED) visits for motor vehicle traffic injuries during 2010–2011 based on nationally representative data from the National Hospital Ambulatory Medical Care Survey (NHAMCS).

Did ED visit rates for motor vehicle traffic injuries differ by age?

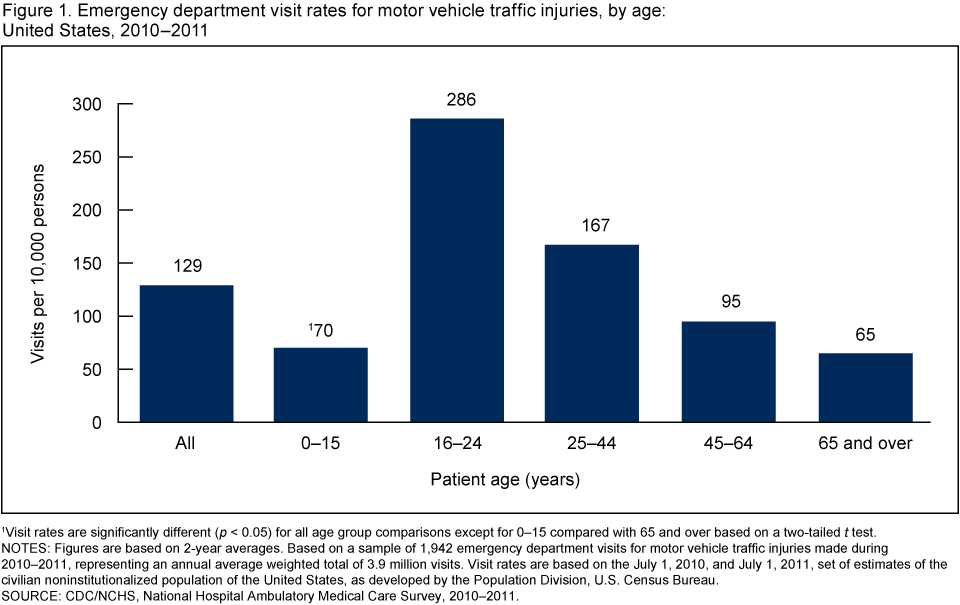
  • In 2010–2011, there were an estimated 3.9 million annual average ED visits for motor vehicle traffic injuries. The overall ED visit rate for motor vehicle traffic injuries was 129 per 10,000 persons (Figure 1).
  • The ED visit rate for motor vehicle traffic injuries was highest among persons aged 16–24 years. The rate increased from 70 per 10,000 persons among those aged 0–15 to peak at 286 per 10,000 persons for those aged 16–24. The rate then declined with increasing age, reaching a rate of 65 per 10,000 persons for those aged 65 and over.
Figure 1. Emergency department visit rates for motor vehicle traffic injuries, by age: United States, 2010–2011
Figure 1 is a bar chart showing emergency department visit rates for motor vehicle traffic injuries by age for combined years 2010 and 2011.
1Visit rates are significantly different (p < 0.05) for all age group comparisons except for 0–15 compared with 65 and over based on a two-tailed t test.
NOTES: Figures are based on 2-year averages. Based on a sample of 1,942 emergency department visits for motor vehicle traffic injuries made during 2010–2011, representing an annual average weighted total of 3.9 million visits. Visit rates are based on the July 1, 2010, and July 1, 2011, set of estimates of the civilian noninstitutionalized population of the United States, as developed by the Population Division, U.S. Census Bureau.
SOURCE: CDC/NCHS, National Hospital Ambulatory Medical Care Survey, 2010–2011.

Did ED visit rates for motor vehicle traffic injuries differ by race and ethnicity?

  • The overall ED visit rate for motor vehicle traffic injuries was higher among non-Hispanic black persons (260 per 10,000 persons) compared with non-Hispanic white persons (119 per 10,000 persons) and Hispanic persons (104 per 10,000 persons) (Figure 2).
  • The visit rate was higher for non-Hispanic black persons compared with Hispanic persons for all age groups. The visit rate was higher for non-Hispanic black persons compared with non-Hispanic white persons for all age groups except 16–24.
  • For persons aged 16–24, the visit rate was higher for non-Hispanic white persons compared with Hispanic persons.
Figure 2. Emergency department visit rates for motor vehicle traffic injuries, by age and race and ethnicity: United States, 2010–2011
Figure 2 is a bar chart showing emergency department visit rates for motor vehicle traffic injuries by age and race and ethnicity for combined years 2010 and 2011.
1Visit rate for non-Hispanic black persons is significantly different (p < 0.05) from non-Hispanic white persons and Hispanic persons based on a two-tailed t test.
2Visit rate for Hispanic persons is significantly different (p < 0.05) from non-Hispanic white persons and non-Hispanic black persons for the age group 16–24 based on a two-tailed t test.
NOTES: Figures are based on 2-year averages. Visit rates are based on the July 1, 2010, and July 1, 2011, set of estimates of the civilian noninstitutionalized population of the United States, as developed by the Population Division, U.S. Census Bureau.
SOURCE: CDC/NCHS, National Hospital Ambulatory Medical Care Survey, 2010–2011.

Did arrival by ambulance, triage status, and hospital admission differ for motor vehicle traffic injury ED visits compared with other injury-related ED visits?

  • Ambulance was the mode of arrival for 42.9% of ED visits for motor vehicle traffic injuries. This percentage was more than twice as high as for other injury-related ED visits (16.6%) (Figure 3).
  • In spite of more frequent arrival by ambulance, the percentage of ED visits for motor vehicle traffic injuries with a triage status of immediate or emergent (11.4%) was only slightly higher than for other injury-related ED visits (8.9%).
  • No statistically significant difference was observed in the percentage of ED visits for motor vehicle traffic injuries leading to hospital admission (5.7%) compared with other injury-related ED visits (6.6%).
Figure 3. Percentage of injury-related emergency department visits, by ambulance arrival, triage status, and hospital admission, according to cause of injury: United States, 2010–2011
Figure 3 is a bar chart showing the percentage of  injury-related emergency department visits by ambulance arrival, triage status, and hospital admission according to cause of injury for combined years 2010 and 2011.
1Percentage is significantly different (p < 0.05) for motor vehicle traffic injuries compared with other causes of injury based on a two-tailed t test.
NOTE: Figures are based on 2-year averages.
SOURCE: CDC/NCHS, National Hospital Ambulatory Medical Care Survey, 2010–2011.

Did the percentage of imaging tests ordered or provided at ED visits for motor vehicle traffic injuries differ from other injury-related ED visits?

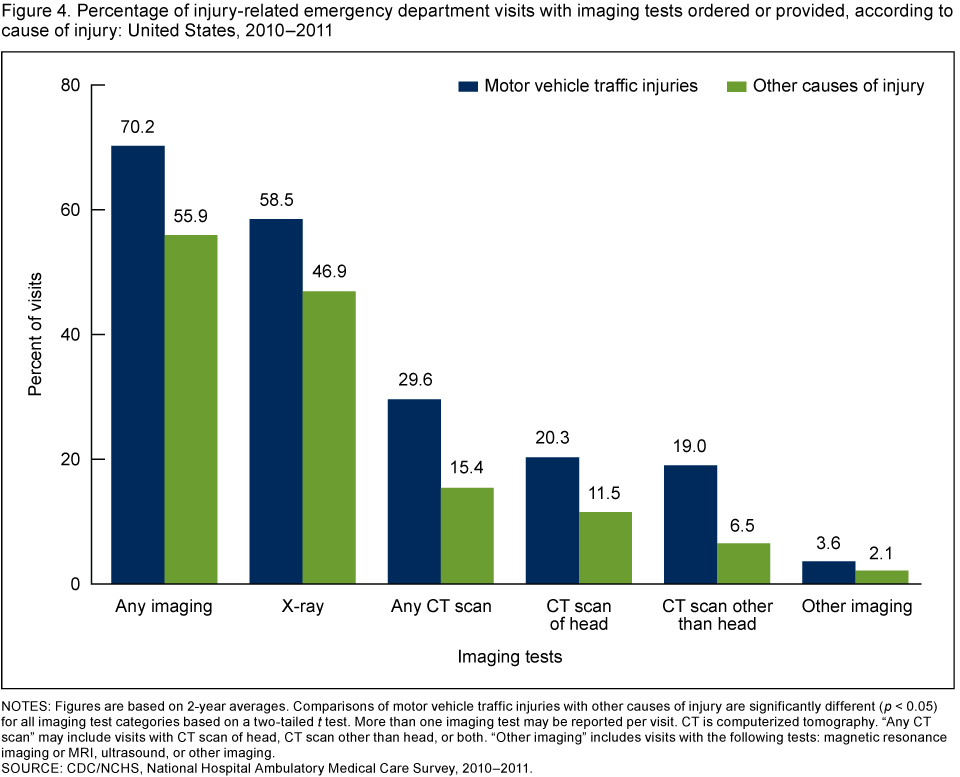
  • Imaging was ordered or provided at 70.2% of ED visits for motor vehicle traffic injuries, which was higher than for other injury-related ED visits (55.9%) (Figure 4).
  • A higher percentage of x-rays, any computerized tomography (CT) scans, head CT scans, CT scans other than head, and other imaging were ordered or provided at ED visits for motor vehicle traffic injuries compared with other injury-related ED visits.
Figure 4. Percentage of injury-related emergency department visits with imaging tests ordered or provided, according to cause of injury: United States, 2010–2011
Figure 4 is a bar chart showing the percentage of injury-related emergency department visits with imaging tests ordered or provided according to cause of injury for combined years 2010 and 2011.
NOTES: Figures are based on 2-year averages. Comparisons of motor vehicle traffic injuries with other causes of injury are significantly different (p < 0.05) for all imaging test categories based on a two-tailed t test. More than one imaging test may be reported per visit. CT is computerized tomography. "Any CT scan" may include visits with CT scan of head, CT scan other than head, or both. "Other imaging" includes visits with the following tests: magnetic resonance imaging or MRI, ultrasound, or other imaging.
SOURCE: CDC/NCHS, National Hospital Ambulatory Medical Care Survey, 2010–2011.

What were the leading primary diagnoses associated with ED visits for motor vehicle traffic injuries? Did these differ from other injury-related ED visits?

  • Sprains and strains of the neck and back (23.6%) was the leading primary diagnosis associated with ED visits for motor vehicle traffic injuries, followed by contusion with intact skin surface (15.2%) and then spinal disorders (8.0%) (Figure 5). These diagnoses, along with observation and evaluation for suspected conditions not found (5.4%), were more likely to be made at ED visits for motor vehicle traffic injuries compared with other injury-related ED visits.
  • Sprains and strains excluding neck and back (6.5%), fractures (6.1%), and open wounds (3.7%) were also among the leading primary diagnoses, but were less likely to be made at ED visits for motor vehicle traffic injuries compared with other injury-related ED visits.
Figure 5. Percentage of injury-related emergency department visits, by leading primary diagnoses, according to cause of injury: United States, 2010–2011
Figure 5 is a bar chart showing the percentage of injury-related emergency department visits by leading primary diagnoses according to cause of injury for combined years 2010 and 2011.
NOTES: Figures are based on 2-year averages. Categories based on the International Classification of Diseases, Ninth Revision, Clinical Modification (ICD–9–CM). All percentages are significantly different (p < 0.05) for motor vehicle traffic injuries compared with other causes of injury based on a two-tailed t test.
SOURCE: CDC/NCHS, National Hospital Ambulatory Medical Care Survey, 2010–2011.

Summary

This analysis of NHAMCS data indicates that in 2010–2011, there were approximately 3.9 million ED visits for motor vehicle traffic injuries annually, which accounted for 10.1% of all injury-related ED visits. Visit rates were highest among those aged 16–24 and then declined with age, with rates for persons aged 0–15 similar to those for persons aged 65 and over. Visit rates were also higher for non-Hispanic black persons compared with non-Hispanic white and Hispanic persons. Although arrival by ambulance occurred more than twice as often for ED visits for motor vehicle traffic injuries than for other injury-related ED visits, the percentage with a triage status of immediate or emergent was only slightly higher, and there was no difference in the percentage admitted to the hospital. Imaging was more frequently ordered or provided at ED visits for motor vehicle traffic injuries compared with other injury-related ED visits. Finally, sprains and strains of the neck and back, contusion with intact skin surface, and spinal disorders accounted for about one-half of all ED visits for motor vehicle traffic injuries.

Injury prevention objectives were recently outlined for Healthy People 2020, and these include reducing motor vehicle crash-related deaths and nonfatal motor vehicle crash-related injuries (5). Data on the rates and characteristics of ED visits for motor vehicle traffic injuries can help inform public health efforts aimed at meeting these objectives and continuing the progress made in improving motor vehicle safety.

Definitions

Injury-related visit: A visit in which a first-, second-, or third-listed external cause of injury, or first-, second-, or third-listed reason for visit or diagnosis code that is injury- or poison-related was recorded. Adverse effect and medical and surgical misadventure or complication external cause-of-injury codes were excluded; however, if these codes were present in combination with other valid definitional codes, the visit was considered injury-related. Diagnosis and external cause of injury were coded using the International Classification of Diseases, Ninth Revision, Clinical Modification (ICD–9–CM) (6).

Visit for motor vehicle traffic injury: An injury-related visit with a first-listed external cause-of-injury code of 810–819 from the ICD–9–CM (6). Specifically, these codes are:
  • E810—Motor vehicle traffic accident involving collision with train
  • E811—Motor vehicle traffic accident involving re-entrant collision with another motor vehicle
  • E812—Other motor vehicle traffic accident involving collision with motor vehicle
  • E813—Motor vehicle traffic accident involving collision with other vehicle
  • E814—Motor vehicle traffic accident involving collision with pedestrian
  • E815—Other motor vehicle traffic accident involving collision on the highway
  • E816—Motor vehicle traffic accident due to loss of control, without collision on the highway
  • E817—Noncollision motor vehicle traffic accident while boarding or alighting
  • E818—Other noncollision motor vehicle traffic accident
  • E819—Motor vehicle traffic accident of unspecified nature
 References
  1. CDC. Ten significant public health achievements—United States, 2001–2010: Motor vehicle safety.
  2. CDC. Injury prevention & control: Motor vehicle safety.
  3. CDC. FastStats: Accidents or unintentional injuries.
  4. Naumann RB, Dellinger AM, Zaloshnja E, Lawrence BA, Miller TR. Incidence and total lifetime costs of motor vehicle-related fatal and nonfatal injury by road user type, United States, 2005. Traffic Inj Prev 11(4):353–60. 2010.
  5. U.S. Department of Health and Human Services, Office of Disease Prevention and Health Promotion. Healthy People 2020 topics and objectives: Injury and violence preventionExternal Web Site Icon. Washington, DC.
  6. Centers for Medicare & Medicaid Services. International classification of diseases, ninth revision, clinical modification, 6th ed. DHHS Pub No. (PHS) 06–1260. 2006.
  7. NCHS. 2010 NHAMCS micro-data file documentation


Friday, February 20, 2015

New CPT Codes Support Medicare Payment for Care Coordination

Medicare is now accepting newly created Current Procedural Terminology (CPT) codes for care coordination to pay physicians for the management of patients who have recently been discharged from a hospital or skilled nursing facility.

The American Medical Association CPT Editorial Panel created new codes (99495 and 99496) with broad input from the health care community to capture transitional care management services. The codes allow for efficient reporting of time spent discussing a care plan, connecting patients to community services, transitioning them from inpatient settings and preventing readmissions.

Last year the AMA called on the Centers for Medicare & Medicaid Services (CMS) to adopt the new codes and cover the related services to support physicians participating in emerging models of care, such as patient-centered medical homes, accountable care organizations (ACOs) and other novel integrated delivery systems.

“Medicare’s acceptance of the new codes signals that CMS recognizes the important role these services have in improving the overall quality of health care,” said AMA President-elect Ardis Dee Hoven, M.D. “The decision supports the work involved in transitioning patients from one care setting to the next and physicians working in emerging models of care.”

The AMA/Specialty Society RVS Update Committee (RUC) also played an essential role in providing Medicare with insight and recommendations on the value of the work and resources associated with services reported by the new transitional care codes.

Ref: www.ama-assn.org

CMS Releases ICD-10 Testing FAQs

The Centers for Medicare & Medicaid Services (CMS) recently introduced a new resource for healthcare providers and others who plan to participate in Medicare ICD-10 acknowledgement testing, or ICD-10 end-to-end testing.

Lists frequency asked questions (FAQs) regarding registration for testing, who may participate, the expected benefits of testing, and more.
CMS acknowledgement testing is open to all fee-for-service electronic submitters. As explained in SE1501, the goal of acknowledgement testing is to demonstrate that:
  • Providers and submitters can submit claims with valid ICD-10 codes and ICD-10 companion qualifier codes;
  • Providers submitted claims with valid National Provider Identifiers (NPIs)
  • The claims are accepted by the Medicare FFS claims systems; and
  • Claims receive 277CA or 999 acknowledgement, as appropriate, to confirm that the claim was accepted or rejected by Medicare.
Upcoming acknowledgement testing weeks are March 2-6 and June 1-5.
End-to-end testing will be offered to 50 testers per MAC jurisdiction for each testing round. You must be selected by the MAC for this testing. Per CMS, the goal of end-to-end testing is to demonstrate that:
  • Providers and submitters can successfully submit claims containing ICD-10 codes to the Medicare FFS claims systems;
  • Software changes CMS made to support ICD-10 result in appropriately adjudicated claims; and
  • Accurate Remittance Advices are produced.
There are two more end-to-end testing weeks prior to the ICD-10 implementation date of Oct. 1, 2015: April 27-May 1, and July 20-24.

If you haven’t performed testing with all your payers (including Medicare), don’t wait for them to contact you. Reach out to your payers and ask them if they offer ICD-10 testing, and take part. Lessons learned during testing may be vital to a successful transition. Better to confirm your ICD-10 readiness now than to face cash flow problems due to a backlog of unprocessed claims come October.

NCD for LDCT

National Coverage Determination (NCD) for Screening for Lung Cancer with Low Dose Computed Tomography (LDCT)

The Centers for Medicare & Medicaid Services (CMS) issued a final national coverage determination that provides for Medicare coverage of Screening for Lung Cancer with Low Dose Computed Tomography (LDCT). The coverage is effective immediately.

“This is the first time that Medicare has covered lung cancer screening. This is an important new Medicare preventive benefit since lung cancer is the third most common cancer and the leading cause of cancer deaths in the United States,” said Dr. Patrick Conway, chief medical officer and deputy administrator for innovation and quality for CMS.

Medicare will now cover lung cancer screening with LDCT once per year for Medicare beneficiaries who meet all of the following criteria:
  • they are age 55-77, and are either current smokers or have quit smoking within the last 15 years;
  • they have a tobacco smoking history of at least 30 “pack years” (an average of one pack a day for 30 years); and
  • they receive a written order from a physician or qualified non-physician practitioner that meets certain requirements.
Medicare coverage includes a visit for counseling and shared decision-making on the benefits and risks of lung cancer screening. The NCD also includes required data collection and specific coverage eligibility criteria for radiologists and radiology imaging centers, consistent with the National Lung Screening Trial protocol, U.S. Preventive Services Task Force recommendation, and multi-society multi-disciplinary stakeholder evidence-based guidelines.

“We believe this final decision strikes an appropriate balance between providing access to this important preventive service and ensuring, to the best extent possible, that Medicare beneficiaries receive maximum benefit from a lung cancer screening program,” Conway said.

Ref: cms.hhs.gov

Thursday, February 19, 2015

Medicare Reimbursements

"The announcement by the U.S. Department of Health and Human Services aligns with the American Medical Association's commitment to work toward innovative care delivery reform that will promote high-quality and efficient care for our nation's seniors who count on Medicare, while reducing the administrative and regulatory burdens physicians face today.

"Physicians have many ideas for redesigning and improving the delivery of high-quality patient care in this country. We strongly support reform of the Medicare payment system, including elimination of Medicare's flawed sustainable growth rate formula, which provides a pathway for physicians to innovate and develop new models of health care delivery for our patients.

"We look forward to hearing more details behind the percentages HHS put forward as well as their plans to reach these percentage targets.

"We staunchly support efforts that will improve the information and data available to physicians so that they will have better information for better decisions about treatment plans for their patients, and we look forward to participating in the Learning and Action Network and working collaboratively to achieve the goals of improving health care delivery.

"Patients benefit when physicians have the flexibility and resources to redesign care, and when payers provide new payment models that can support physician efforts to improve patient care and lower health care costs over the long-term.